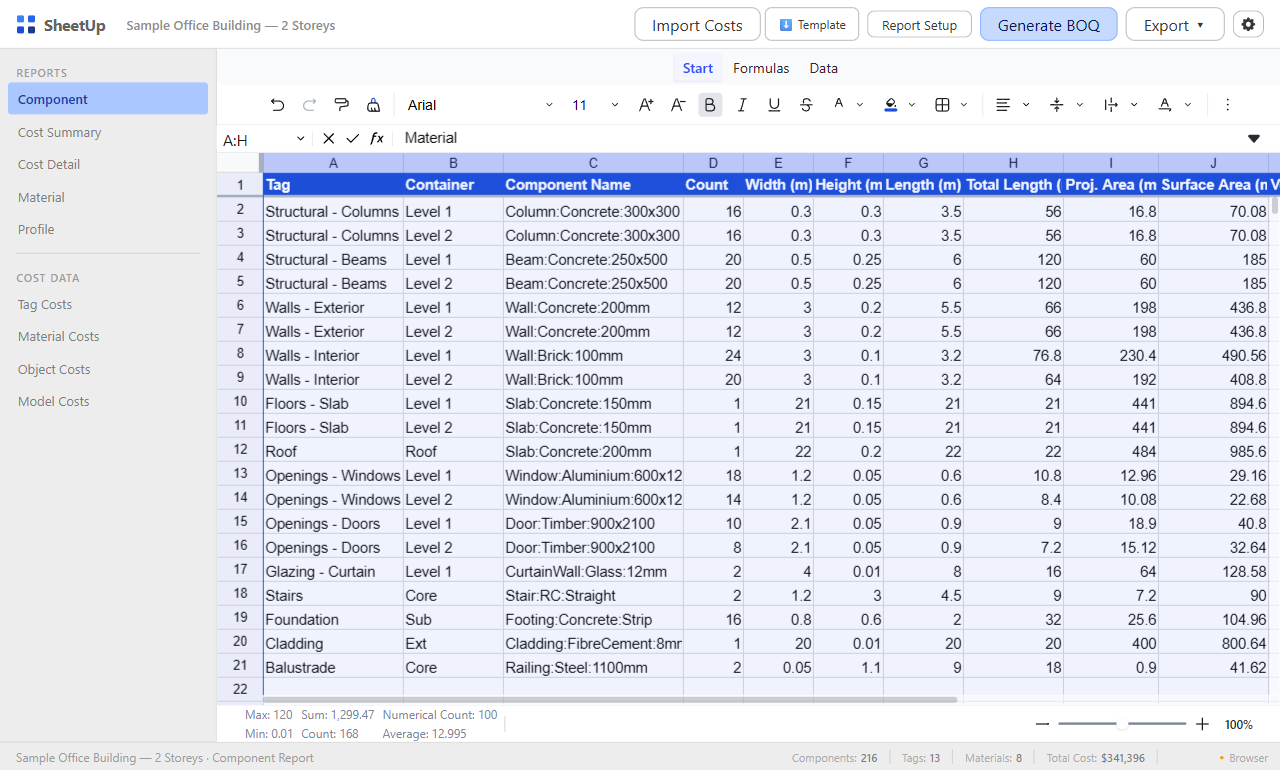
SheetUp exports a SketchUp estimate as one flat Excel sheet: a sheet named Estimate with one row per estimate row and 25 columns, in which each row’s Total and the totals block under the table are live Excel formulas. Grouping the rows by tag, material or source is left to Excel, for example with a PivotTable. SketchUp’s own Generate Report is the other route: it downloads a CSV of component attributes. This guide covers what each produces, what is inside the SheetUp file, and how to prepare the model.
Pick the route by the file you need
| Route | What you get | Format |
|---|---|---|
| Generate Report (File menu) | A table of component and group attributes, grouped and totaled as the template says | CSV (the help pages describe CSV only) |
| SheetUp, Excel (.xlsx) | One flat sheet, one row per estimate row, live Total formulas and a totals block | .xlsx |
| SheetUp, CSV | The same 25 columns as values, no formulas, no totals block | .csv |
| SheetUp, HTML report | The table and the totals on one page with the project name and date | .html |
| SheetUp, Copy to clipboard | Header and rows, tab separated, ready to paste into a sheet | Clipboard |
| SheetUp, Print | The HTML report through the print dialog | Print dialog |
| SheetUp, Import lines | Reads an exported XLSX or CSV back into the estimate | .xlsx or .csv |
What SketchUp’s Generate Report gives you
Generate Report builds a table in which each column is an attribute and each row holds attribute values. The steps from the SketchUp help:
- Choose File > Generate Report to open the Template Manager.
- Create a template or select one. A template stores the scope (Entire Model or Current Selection), the component nesting levels, the report attributes in column order, the Group By fields and the units (Architectural, Decimal, Engineering or Fractional Inches, with a precision).
- Click Run to preview the table, then Download to save it as a CSV file.
The help describes a Component Quantities template that lists component names and the quantity of each by putting Definition Name in Group By. Group By collects attribute values, and numeric attributes such as price or length can be subtotaled, with a total that adds the subtotals of the whole group. Templates travel as .grt files through Export and Import, or inside the model. The help says the CSV can be opened in a spreadsheet program or inserted into LayOut as a table.
Two limits matter for a material list. The attributes belong to components and groups (Definition Name, Tag, Price, a classification type, bounding-box lengths), so the table is a component list. And the area of the faces painted with a material is not among the attributes the help describes: in a community thread where the original poster tried to get areas by material, the answers include extensions and the Materials panel, where a material’s context menu gives Area > Material for one material at a time (help).
Export the estimate with SheetUp
SheetUp does not list the model for you. The estimate is one table of rows that you add by hand, and the export writes that table. The steps:
- Prepare the model with the checklist below: tags, group and component names, material names.
- Open SheetUp from the Extensions menu. In the bar at the bottom of the window press Add row; one popover offers Custom row, Component…, Material…, Tag… and, when objects are selected in SketchUp, From selection. A custom row is text with a typed quantity and unit. The three pick-lists are searchable with a checkbox on each entry: clicking an entry only ticks it, Select all results ticks everything the search shows, and Add N selected adds the ticked entries in one undo step. From selection adds one Component row for each distinct component you selected in SketchUp.
- Set Per in its dropdown, one scrollable list under headings: Each; Length, Width and Height (m, mm, cm, in, ft, yd); Surface area and Area W×H (m², ft², yd²); Volume (m³, ft³, yd³); Weight (kg, t, lb, ton, where t is the metric tonne and ton the US short ton of 2000 lb). A material row offers Surface area and Each. A new Component or Tag row starts at Each and a Material row at Surface area, so choose Volume yourself where you price by volume. Choosing another unit of the same kind (m³ to yd³) converts the price, so the money stays the same; choosing another kind (m³ to m²) keeps the number you typed. Then set Factor (a number, or a fraction such as 1/2 or /2, which is stored as 0.5) if the quantity needs a multiplier and Price per unit shown in Per. Leave Waste % and Tax % blank to use the defaults from Settings. The last row of the table is the grand total.
- Open Settings (the Settings button at the top right) for Metric or Imperial units, the default waste and tax percentages, currency, number format and decimals. The Columns button next to it shows and hides grid columns (Scope, Billed qty and Billed unit start hidden); hidden columns are still exported.
- Open Export and choose Excel (.xlsx). SketchUp’s save dialog opens with the suggested name <model name>_Estimate.xlsx. An export needs at least one row, and while quantities are still being measured SheetUp asks you to try again in a moment (the Qty cells show measuring…). Quantities measure again by themselves about 1.5 seconds after the model changes.
Saving an XLSX, CSV or HTML file counts as an export under the daily free allowance and may ask for a free 3dshouse account; Copy, Print and Import do not. How each source kind is measured is in the SheetUp guide for SketchUp.
What is inside the Estimate sheet
The sheet has a frozen header row and an autofilter over the table. The 25 columns, in order (A to Y):
| Columns | Content |
|---|---|
| Code, Name | The row’s code (generated from the name, for example CMP-GROUND-SLAB-01, editable; the prefix CMP, MAT, TAG or CUS gives the kind) and its name: the live name of the component, tag or material, or the text you typed on a custom row. The default tag shows as Untagged, unpainted faces as Not assigned |
| Source type, Tag, Scope | Custom, Component, Material or Tag; the tag is filled for Component and Tag rows only (a part left on Layer0, shown as Untagged, inside a tagged group counts on that group’s tag). Scope is filled for Component rows only: With parts (the default, the component with every part nested in it) or Own only (its own geometry, as a tag row sums it) |
| Count, Width, Height, Length, Total length, Surface area, Area W×H, Volume, Weight | The measures of model rows, in the display units named in the header. Surface area is the area of all faces. Area W×H is the projected outline area of the component along its smallest bounding-box axis, times the instance count: for a closed solid, openings cut through it are deducted, so a 4 × 3 m wall 0.2 m thick with a 1 × 1 m opening reads 11 m² per piece against a surface area of 25.6 m²; open geometry uses its bounding rectangle. A tag row has no width, height or length, and a material row has only a face count and a surface area. Custom rows leave these blank |
| Qty, Per, Factor, Billed qty, Billed unit, Price | The quantity in the unit shown in Per (a count for Each, as typed for a custom row), the Per label such as Volume (yd³), Length (mm) or Area W×H (m²), the factor, the billed quantity (Qty × Factor, a formula) with the free-text unit of a model row such as MH, bags or truckloads, and the price per unit shown in Per. An unpriced row has an empty Price cell. A row whose component, material or tag is no longer in the model shows not found in this model in the app and exports with Qty 0 and blank measures |
| Waste %, Tax %, Total | The percentages that apply to the row (the Settings default when the row has none of its own), and the row total |
| Weight per, Density | Component and Tag rows. Density is the row’s own unit weight and Weight per says what it is per, written as the metric label: kg/m³ (volume), kg/m² (area W×H), kg/m² (surface area), kg/m (length) or kg each. Density is always metric whatever the display system and blank when the row has none |
Units are part of the header, for example Surface area (m²) or Volume (ft³), and the Price and Total headers carry the currency code. Qty and Price are in the unit named in the row’s Per cell. Prices are stored per metric unit and shown per the row’s unit, so switching between Metric and Imperial changes the numbers in the file but never the totals.
Live formulas in the file
Every row’s Total is the same calculation SheetUp uses, written as a formula over the row’s own cells:
Total = Qty × Factor × Price × (1 + Waste % / 100) × (1 + Tax % / 100)
In the sheet, row 2 holds =O2*Q2*T2*(1+U2/100)*(1+V2/100), because Qty, Factor, Price, Waste % and Tax % are columns O, Q, T, U and V; the Billed qty in R2 is =O2*Q2. Under the table, after one blank row, the totals block lists Lines, Lines priced, Subtotal, Waste, Tax and Total, with the labels in column A and the values in the Total column (column W). Each one is a formula over the table’s columns and is stored together with its calculated value, and the workbook is flagged to recalculate when it opens. The app shows only the grand total, as the last row of its table; the breakdown exists in the file.
A worked example, with the default Tax % in Settings set to 20 and a Waste % of 5 and 10 on two rows:
| Source type | Name | Qty | Per | Price | Waste % | Tax % | Total |
|---|---|---|---|---|---|---|---|
| Component | Ground slab | 24.00 | Volume (m³) | 310.00 | 5 | 20 | 9,374.40 |
| Material | Oak veneer | 38.50 | Surface area (m²) | 42.00 | 10 | 20 | 2,134.44 |
| Component | Door D1 | 6 | Each | 480.00 | 0 | 20 | 3,456.00 |
| Custom | Site cleaning | 1 | item | 650.00 | 0 | 20 | 780.00 |
The slab row: 24 × 310 = 7,440.00; waste 7,440 × 5 % = 372.00; tax (7,440 + 372) × 20 % = 1,562.40; total 9,374.40. The totals block then reads: Lines 4, Lines priced 4, Subtotal 12,587.00, Waste 533.70, Tax 2,624.14, Total 15,744.84, which is also the sum of the four row totals. In this example the Subtotal in W9 is =SUMPRODUCT(O2:O5,Q2:Q5,T2:T5). Change the Price of the slab in Excel and the row total, the Subtotal, the Tax and the Total all follow.
Two things to know. The formulas use only Qty, Factor, Price, Waste % and Tax %; editing a measure such as Surface area or Volume changes nothing, and editing Qty in Excel changes the file, not the SketchUp model. For a model row, Qty is the measured quantity before the factor.
Group and total in Excel
SheetUp has no report tabs; the sheet is built so that Excel does the grouping. Microsoft’s PivotTable page asks for data in columns with a single header row and no blank rows or columns, which is how the table is laid out: the totals block sits after one blank row, so select the table, A1 to the last row of column Y, rather than the whole sheet.
- PivotTable. Insert > PivotTable on that range. Put Tag or Name in Rows and the Total column in Values for a cost by tag or by component, or put Source type in Rows to see components, materials, tags and custom items apart. Add Surface area, Area W×H, Volume or Weight to Values for quantities by tag. Tag is blank on Material and Custom rows, so filter Source type to Material and use Name for a cost by material. After changing the data, refresh the PivotTable.
- A single formula. SUMIFS adds a column by a criterion: with the rows 2 to 5 of the example,
=SUMIFS(W2:W5,C2:C5,"Component")returns 12,830.40, the slab and the door. - Filter and sort. The autofilter is already on the header row.
Overlap is the one trap. A Component row and a Tag row, or a component and its nested part as separate rows, can measure the same geometry, and SheetUp deducts nothing for you. In the app the Code prefix (CMP, MAT, TAG, CUS) shows what each row points at; in the file the Source type column does the same job, so filter on it before you add up a column.
The other formats
- CSV. The same 25 columns, values only: no formulas and no totals block. It is saved as UTF-8 with a byte-order mark. Numbers are rounded to the decimals shown in SheetUp, written with the decimal mark from Settings and without a thousands separator or currency sign (the XLSX, by contrast, keeps the exact numbers and only formats the display). If a text cell starts with =, +, -, @, a tab or a carriage return, SheetUp prefixes it with an apostrophe so a spreadsheet cannot read a tag or component name as a formula.
- HTML report. A page titled Estimate with the project name and the date, the table with your separators, and the totals block below it; it prints in landscape with the header repeated on each page.
- Copy to clipboard. Header plus rows, tab separated, the same cell values as the CSV and no totals block. Pasted into a sheet, each value lands in its own cell.
- Print. Opens the print dialog with the HTML report.
The decimal mark matters for CSV. With a comma decimal mark SheetUp switches the delimiter to a semicolon; Microsoft’s page on CSV files describes the same pairing in Excel, a comma decimal separator with a semicolon list separator. In an XLSX the separators come from the program that opens it, not from the SheetUp setting.
Bring edited rows back with Import
Rates and factors often get adjusted in a spreadsheet, so SheetUp reads its own file back. Choose Export > Import lines…, pick an XLSX or CSV exported by SheetUp, and decide in the small confirm whether to Replace all lines or Add to the list; either is one undo step in SketchUp.
- Columns are found by their header text (the unit in brackets and capital letters are ignored), so keep the header row. Reading stops at the first blank row, which is where the totals block starts, so do not insert blank rows inside the table.
- Source type, Tag and Name decide what a row points at. Components, materials and tags are matched by tag and name; one that is not in the open model becomes a not found row with quantity 0 until fixed. For that reason do not rename a model row in Excel: renaming it in SheetUp’s own Name cell renames the real component, tag or material in the SketchUp scene, which is a different action.
- A wildcard is the one exception. A Name ending in * on a Component, Material or Tag row (for example Concrete*) expands to one row for every component, material or tag whose name starts with that text, ignoring capitals. Each new row takes the Per, Factor, Price, Waste % and Tax % of that row and gets a fresh Code; on a Component row a filled Tag cell must match as well. When nothing matches, one not found row is kept and the message says so. A component really named with a trailing * expands too.
- Model quantities are always measured again from the model. A Custom row keeps the Name, Qty, Per text and Price you typed.
- For a model row the Price is read per unit of that row’s Per (the label as exported, such as Volume (yd³) or Area W×H (m²), or a bare name or symbol: m, mm, cm, in, ft, yd, m², ft², yd², m³, ft³, yd³, kg, lb, t, ton or each; a bare area symbol means the surface area) and stored per metric unit; a unit other than the default of the Settings system is kept as the row’s unit. A model row whose Per cell holds no known unit ignores its price, and SheetUp says so.
- Code, Factor, Waste % and Tax % are read when the cell holds a valid value; a Factor may be a fraction such as 1/2. A row that used the Settings default for waste or tax therefore carries that number explicitly after an import.
- Weight per, Density, Scope and Billed unit are read by header name only. Weight per (the label as exported, or a name such as length) and Density (always metric, in the unit of that label) set the unit weight of a Component or Tag row; Scope sets Own only on a Component row; Billed unit sets the free text of a model row. Billed qty is Qty × Factor and is ignored. A file exported by an earlier SheetUp, without these columns, still imports: its rows weigh by volume with no density, and With parts scope.
Rows that cannot become a row are skipped and counted in the message. Nothing is imported from a file that has no SheetUp column names.
Limits to know
- The English interface. Sheet name, headers and labels are in English; SheetUp has no language setting.
- The export is a snapshot. It holds the quantities measured at the moment you save. Wait until the Qty cells no longer say measuring… after a model change, then export again.
- No PDF export. Print opens the system print dialog; SheetUp offers no PDF file of its own.
- Volume and weight are exact only for closed solids; see how volume is measured. For open geometry the volume is an estimate from the mesh, marked ≈ with a warning in the app. Weight is the measure named by Weight per (volume, Area W×H, surface area, total length or the instance count) times the row’s Density. With the default kg/m³ (volume) and a blank Density, a built-in table by material name gives the density, and with no entry the weight is 0 with a warning; for the other four a blank Density gives weight 0 until you type a number. Open geometry gets no hole deduction: its Area W×H is the bounding rectangle.
- An older installed extension can meet the current page: SheetUp then shows a banner asking you to update it in Extension Manager and restart SketchUp. Until then model rows export with quantity 0; custom rows and the exports themselves keep working.
Checklist for a clean export
- Tags. Give every group and component a tag. A component is identified by its tag and name; the default tag appears as Untagged, and a part left on Layer0 inside a tagged group counts on that group’s tag.
- Names. Name groups and components, and use one definition per part type with different names for different sizes, because instances with the same tag and name become one component in the pick-list.
- Materials. Paint faces, or the parent group or component, with a named material. An unpainted face takes the material of the nearest painted parent instance; the rest appears as Not assigned. Keep names consistent (Oak, not oak 2 or Oak copy), because a Material row is the surface area of one material name and the built-in density table looks up weight by material name.
- Solids. Close the geometry of items whose volume, weight by volume or Area W×H you will report.
- Before exporting. Check the units, currency and number format in Settings, and read the last row of the table: it is the total you will find again in the file.
What I could not check
- How the files behave in Excel, Numbers or Google Sheets. I read the code that writes the files and describe what it writes; I did not open an exported workbook in Excel here, so recalculation on open, the column letters on a real file, the PivotTable steps on this particular sheet and the display of the CSV are not tested. Open one export in your own program before sending it on.
- The extension running inside SketchUp. The steps in the app come from the extension’s source and documentation, not from a session in SketchUp for this article.
- Which SketchUp plan includes Generate Report. SketchUp’s own 2022 blog post describes it as something SketchUp Pro can do; the current help pages and the plan comparison page do not state a tier. Check your plan before relying on it.
- HTML output from Generate Report. The current help describes CSV only; I found no HTML option documented.
- Whether Generate Report can total material area. I found no documented attribute for it, and the evidence is the community thread above, not a statement from SketchUp.
Sources
- Using SketchUp’s Generate Report Service, SketchUp help.
- Generating an Attribute Report, SketchUp help.
- Calculating Material Area, SketchUp help.
- Generating reports from your models, SketchUp blog, 18 August 2022.
- Generate Report: retrieve areas by material of a selection, SketchUp Community.
- Create a PivotTable to analyze worksheet data, Microsoft Support.
- SUMIFS function, Microsoft Support.
- Import or export text (.txt or .csv) files, Microsoft Support.
- SheetUp behaviour: the extension’s own source and documentation, read for this article.
For pricing the rows you export, see the SketchUp cost estimate guide; for turning quantities into material orders, see calculating material quantities from a SketchUp model.
Frequently asked questions
Can SketchUp export a material list to Excel?
SketchUp’s Generate Report downloads a CSV of component and group attributes, which spreadsheet programs open. SheetUp writes an XLSX workbook directly: one sheet named Estimate with one row per estimate row, including the measured surface area, projected area (Area W×H), volume and weight, the price and the total of each row.
Does the exported Excel file contain formulas?
Yes, in the XLSX. The Total and the Billed qty (Qty × Factor) of every row, and the totals block under the table (Lines, Lines priced, Subtotal, Waste, Tax, Total), are Excel formulas, stored with their calculated values. Changing Qty, Factor, Price, Waste % or Tax % in Excel recalculates them. The measured columns (Count, Width, Surface area, Volume and so on) are plain numbers, and the CSV carries values only.
How do I total the estimate by tag or by material in Excel?
Build a PivotTable on the Estimate sheet: select the table, choose Insert > PivotTable, put Tag or Name in Rows and the Total column in Values. SheetUp does no grouping of its own; the export is one flat table so that Excel can do it. Tag is filled only for Component and Tag rows, so for a cost by material filter Source type to Material and put Name in Rows. Filter Source type as well if a component row and a tag row cover the same geometry.
Why does the CSV use semicolons and decimal commas?
When the number format in SheetUp Settings uses a comma as the decimal mark (1.234,50), the CSV uses that decimal comma and a semicolon as delimiter, because Excel pairs a comma decimal separator with a semicolon list separator. With a point as the decimal mark the delimiter is a comma.
Can I change prices in Excel and bring them back into SketchUp?
Yes. Edit the exported file, keep the header row, then use Export > Import lines… in SheetUp and choose to replace all lines or add to the list. Components, materials and tags are matched by tag and name and measured again from the model; a custom row keeps its typed quantity and price. Change Price, Factor, Waste % or Tax % in Excel, not the Name of a model row, unless you want a wildcard: a Name ending in * (for example Concrete*) expands to one row for every component, material or tag whose name starts with that text. Import does not use a free export.
Does hiding a column in SheetUp remove it from the export?
No. The Columns button hides columns in the SheetUp grid only; the data is kept and every one of the 25 columns, including Scope, Billed qty and Billed unit, which start hidden, is still written to the XLSX, CSV, HTML report and clipboard text.
Why does Generate Report return an empty or unexpected table?
Check three settings in the template. The scope is Entire Model or Current Selection (a selection must exist before you open the service). The nesting level decides which objects count; the help says level 2 is often right for top-level components. The attributes and Group By fields decide the columns; the Component Quantities template described in the help groups by definition name.
Free: limited to 3 exports a day
Pro: unlimited, guaranteed to work, priority support
- BevelUp — round or chamfer edges into real geometry, in one click
- Decimify — reduce the polygon count of a heavy model
- Tracepen — trace an image into SketchUp faces
- TileUp — turn a face into real 3D tiles, with a take-off
- Texturic — make seamless tile textures with PBR maps
- SheetUp — turn a SketchUp model into a bill of quantities and cost estimate